How we are helping reduce carbon and greenhouse gas emissions
In line with national and global targets, we have already met our previous carbon emission reduction target of 40% by 2020, as reductions of 45% were made between 2009 and 2018. Through our Sustainable Enfield programme, we have set a new 60% carbon reduction target by 2025.
Carbon Management Plan
The content of our Carbon Management Plan follows the format set by the Carbon Trust and sets out all the projects that are reducing the size of our carbon footprint.
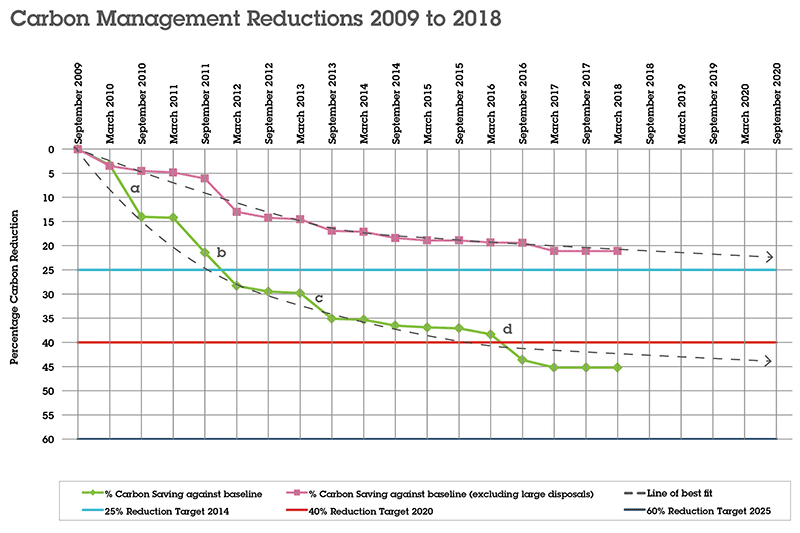
Reductions in the first couple of years, shown by the steep lines a, b and c, resulted from the disposal of our 5 leisure centres, shown at a. These were taken over by Fusion Leisure Limited and a number of schools also moved to academy status, shown at b and d.
We invested over £6 million to improve the energy efficiency of the Civic Centre, Charles Babbage House, Millfield Theatre, 11 large schools and our street lights, shown at c.
Although successfully reducing our carbon footprint by approximately 45% since 2009, we also need to consider our actual energy consumption.
Carbon Reduction Commitment
The Carbon Reduction Commitment (CRC) Energy Efficiency Scheme measures our actual energy consumption, which we are legally required to report to the Environment Agency each year.
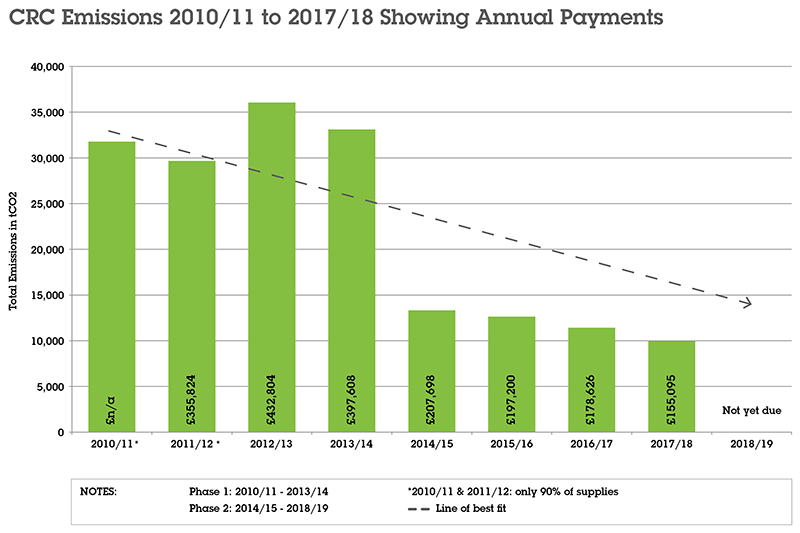
Several significant changes to the scope of reporting make annual reduction comparisons difficult. For example, in 2010-2011 and 2011-2012, only 90% of supplies were required to be reported. This rose to 100% from 2012-2013. Schools were removed from the scheme at the start of 2014-2015.
Our reported energy consumption has reduced by over 60% over the last 5 years. This success has been driven by our energy saving projects, during a time when we’ve increased the use of our remaining buildings, expanded our schools and provided additional street lights.
Greenhouse gas emissions
Since 2009, we have also been required to measure our greenhouse gas emissions from:
- natural gas used by council buildings and schools
- fuel used by council vehicles and major contractors
- electricity used by council buildings, schools and street lights
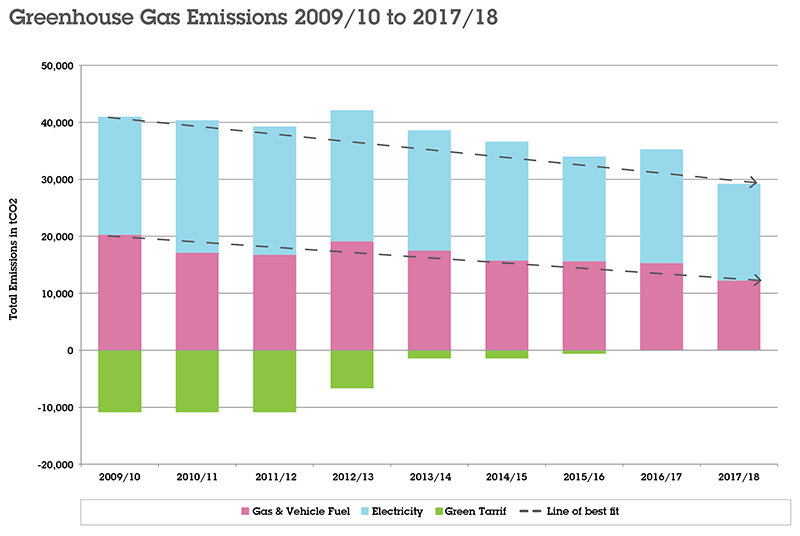
We have reduced our total gross greenhouse gas emissions over the past 5 years, by around 17%. This includes gas and vehicle fuel, shown on the pink bars and electricity consumption, shown on the blue bars. The spike in 2012-2013 was due to a long and very cold winter.
The green tariff, shown by the green bars, represents the amount of renewable energy. For example, from wind and solar, through our contract with Laser Energy Buying Group.
Borough wide carbon emissions
Each year, the Department of Business, Energy and Industrial Strategy (formerly the Department of Climate Change) provides local carbon emission estimates from homes, road transport and industry across Enfield. This is as a percentage reduction of carbon emissions against the 2005 baseline year.
Sustainable Enfield has set a new target of a 60% reduction in Enfield’s borough wide carbon emissions by 2025. In the 11 years from 2005 to 2016, our total carbon emissions have reduced by approximately 28%. This is in the context of our increasing population. We will continue to lead by example and work in partnership to drive this change.
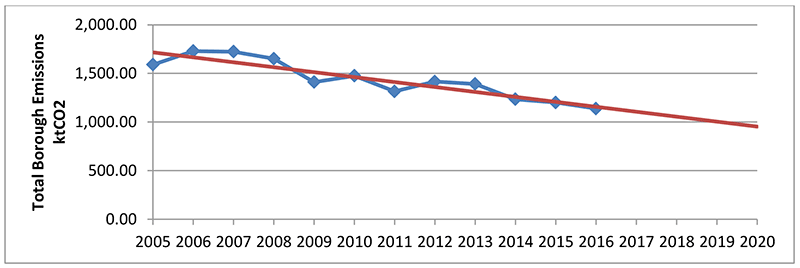
Although emissions have continued to fall, they will need to drop significantly further for London to meet the Mayor’s aim of being zero carbon by 2050. Also, future carbon dioxide emissions reductions are likely to be harder to achieve, as many of the ‘quick wins’ have already been made.